

GUIDE

What Is Data Analytics? A Complete Guide for Businesses

Most businesses already collect plenty of data through their accounting, sales, scheduling, and customer systems. But how do you turn that information into reports your team can use to make better decisions?

Send a PDF copy of this guide to:

Don't Have Time to Read Now?

No worries! We can email you a PDF copy of What Is Data Analytics? A Complete Guide for Businesses, so you can access important information anywhere, anytime.

What You'll Learn

Before investing in data analytics, it helps to understand what it can do for your business and what you'll need to get started. 

Inside, you'll learn:

What data analytics is and how it works

The benefits and challenges of data analytics
Which tools businesses use to analyze and visualize data
How much data analytics can cost
How to tell if your business is ready for data analytics
How to get started

Who Is This Guide For?

This guide is for business leaders who want to better understand data analytics, improve visibility into their operations, and make more informed decisions.

It's especially useful for:

  • Business owners and C-suite executives
    who want a clearer view of company performance.
  • Operations and department leads
    who track goals, key performance indicators (KPIs), and team performance.
  • Finance leaders
    who pull numbers from several different systems.
  • IT managers
    asked to connect data sources and support reporting tools.
  • Decision-makers
    comparing data analytics services who want clear information about tools, costs, and fit.

What Is Data Analytics?

Data analytics is the process of collecting, organizing, and examining business data to identify trends, measure performance, and support better decisions. The results are often presented through reports and dashboards that make the information easier to understand.

For example, you might use data analytics to see which products sell best each month, how long customers take to pay invoices, or which projects are running over budget.


What Is the Difference Between Data Analytics and Business Intelligence?

Business intelligence (BI) focuses on tracking and presenting business performance through reports and dashboards. Data analytics examines that information more closely to identify trends and understand what may be driving the results.

For example, a BI dashboard might show that monthly sales dropped. Data analytics can help you investigate which products, locations, or customer groups contributed to the decline.

The two often overlap, and tools like Microsoft Power BI support both.


What Do You Need to Use Data Analytics?

To use data analytics, you need accessible business data, an analytics tool, and someone who can manage the reporting process.

  • Digital data: Information stored in databases, cloud applications, or spreadsheets
  • An analytics tool: Software that connects to your data and turns it into reports and dashboards
  • People and processes: Someone to set up data connections, build reports, and check that the information stays accurate

You don't need an in-house data scientist to get started with data analytics. Depending on your business needs, an IT or analytics provider can help set up your reporting tools and provide ongoing support.

How Does Data Analytics Work?

Data analytics works by bringing information from your business systems together, preparing it for analysis, and turning it into reports and dashboards that help answer business questions. The process typically involves five steps.
1. Define Your Goals

Define Your GoalsStart with the questions you want answered, such as which services generate the most revenue or where projects fall behind schedule. Your goals help determine which data and reports you need.
2. Connect Your Data Sources

Connect Your Data SourcesYour data may be stored in SQL databases, cloud applications, accounting software, or spreadsheets. Analytics tools can connect to supported sources so you can view information from different systems in one place.
3. Prepare and Clean the Data

Prepare and Clean the DataData from different systems may contain duplicates, missing information, or inconsistent formats. Cleaning the data helps improve the accuracy of your reports.
4. Build Reports and Dashboards

Build Reports and DashboardsReports and dashboards turn data into charts and tables that are easier to understand. Many analytics tools can refresh data on a schedule, giving your team updated reports without having to rebuild them each time.
5. Review and Act on the Results

Review and Act on the ResultsReview your reports regularly and use the results to guide business decisions. As your goals change, you can adjust your reports to track what matters most.

Benefits

What Are the Benefits of Data Analytics?

Data analytics helps you see where things are working, where problems may be developing, and where there's room for improvement. It also gives your team a clearer view of the information that matters most.

Here are five practical benefits worth considering.

Spot Trends in Sales and Operations
Data analytics helps you identify patterns that may be difficult to notice in individual records. For example, you can see which customers buy most often, which web pages attract the most visitors, or when your team is busiest.
Find Bottlenecks in Your Processes
Tracking performance data helps you see where work slows down or problems occur. For example, you can identify where leads drop off, projects fall behind schedule, or tasks pile up.
Make More Informed Business Decisions
With a clearer view of your business performance, you can make decisions based on actual data rather than assumptions. You can also track the results to see whether your decisions are having the intended effect.
Reduce Manual Reporting
Preparing reports by hand takes time and can introduce errors. Dashboards connected to your business systems can reduce manual data entry and give your team updated information without constantly rebuilding reports.
Track Goals and KPIs in One Place
Dashboards can bring your key performance indicators (KPIs) together in one view, making it easier to monitor progress, identify missed targets, and keep your team focused on shared goals.
Challenges

What Are the Challenges of Data Analytics?

Common data analytics challenges include disconnected systems, poor data quality, limited resources, and low team adoption. Knowing what to expect can help you avoid reporting problems and plan your investment.

Here are five challenges to prepare for and how to address them.

Data Analytics Challenges and How to Handle Them

What you can do:

  • Start with your most important data sources.
  • Check whether your analytics tool can connect to them. Item

What Tools Are Used for Data Analytics?

Common data analytics tools include Microsoft Power BI and Tableau. These platforms connect to business data and help you create reports and dashboards. The right choice depends on your existing systems, budget, and reporting needs.
Microsoft Power BI

Microsoft Power BIMicrosoft Power BI helps you turn information from different sources into interactive reports and dashboards. It works with other Microsoft tools, making it a practical option if your business already uses Microsoft 365.

According to Microsoft's pricing page, Power BI Pro costs $14 per user per month, while Premium Per User costs $24 per user per month, both paid yearly. A free account is also available for creating reports, but sharing them may require paid licenses.
Tableau

TableauTableau helps you explore data, spot trends, and turn complex information into easy-to-understand visual reports. Its flexible data visualization options let you examine information from different angles and uncover insights that may not be obvious in standard reports.

When comparing it with Power BI, consider how well each platform works with your existing systems, the overall cost, and how easy it is for your team to use.

How Much Does Data Analytics Cost?

Data analytics costs depend on the software you use, the number of data sources you connect, and the support you need. You'll need to account for both initial setup and ongoing costs to keep your reports accurate and up to date.

What Affects the Cost of Data Analytics?

Several factors can affect how much you pay for data analytics. Among these are:

  • Software licenses: Tools like Microsoft Power BI may require paid licenses to share reports with your team. Your costs depend on the plan and number of users.
  • Number of data sources: Connecting data from multiple applications or databases can increase the work needed to set up and maintain your reports.
  • Setup and ongoing support: You may need help connecting your systems, building dashboards, fixing data issues, and updating reports as your business needs change.

How Much Does ITS Data Analytics Cost?

At Intelligent Technical Solutions (ITS), Data Analytics pricing starts at $1,000 per data source per month, with four hours of support included for each source. Additional work beyond the included hours costs $225 per hour. 

Service Cost

Data source

Starts at $1,000 per month, including four hours of support

Additional support

$225 per hour

For example, if you connect one data source and need 10 hours of support in a month, your estimated cost would be $2,350 at the starting rate. That includes the $1,000 monthly fee and $1,350 for six additional hours.

Building your first dashboards also takes time. Based on ITS's experience with data analytics projects, initial setup typically takes 30 to 50 hours, depending on your reporting needs. If your project requires more than your included support hours, additional development work may be billed at $225 per hour.

Keep in mind that you may also need Microsoft Power BI licenses, depending on how your team accesses and shares reports.

When It May Make Sense to Wait

You may want to address a few things before investing in data analytics if you:

  • Don't yet collect the information you need to answer your most important business questions.
  • Haven't identified what you want to measure or which decisions your reports should support.
  • Have incomplete or inaccurate data that needs to be cleaned up before you can use it.
  • Can't commit the time or budget needed to set up and maintain your reports.

If you're not ready yet, start by identifying the information you already collect and the questions you want it to answer. This can help you prepare for data analytics when the time is right.

How Do You Get Started with Data Analytics?

To get started with data analytics, determine what you want to learn from your data, review the information you already collect, and start with a proof of concept before expanding. You can work with your internal team or a data analytics provider to build reports that support your business goals.

Identify the Business Questions You Want to Answer
Start with the questions you want your data to answer. For example, you might want to understand why sales are declining or which projects are going over budget. Focus on a few important business metrics so your first reports address your most pressing needs.
Take Inventory of Your Data Sources
Identify where your business information is stored, such as accounting software, customer relationship management (CRM) systems, project management tools, or databases. Check whether your data is accurate, up to date, and accessible before using it to build reports.
Start With a Proof of Concept
Begin with a proof of concept: one report or dashboard that addresses a specific business question. This allows you to see how data analytics works with your existing information before investing in a larger solution. You can also use the proof of concept to identify data issues and make improvements before expanding your reporting.
Train Your Team and Review Results
Show your team how to use the reports and interpret the results. Review the results regularly to see whether the reports are helping you make better decisions. As your needs change, you can update your dashboards or add new reports to track other areas of your business.

Why Choose ITS for Data Analytics Services?

Intelligent Technical Solutions (ITS) helps you turn data from your existing business systems into Microsoft Power BI reports and dashboards you can use to track performance and make informed decisions.

You'll work with our team through a clear, three-step process. With transparent pricing, you'll also know what to expect from your investment.

Since 2003, ITS has helped businesses manage their technology needs across industries such as healthcare, financial services, automotive, manufacturing, nonprofits, and architecture and design.


A Clear Three-Step Process

Getting started with ITS Data Analytics involves three steps.

  1. Discover Needs: Meet with a business analyst to discuss your goals and identify what you want your reports to accomplish.
  2. Evaluate Data Sources: Our team identifies where your data is stored, whether in cloud applications, databases, or your network.
  3. Design Reports: Review a proof-of-concept report or dashboard built with your data and provide feedback so we can tailor it to your needs.


Secure, Consent-Based Data Connections

ITS connects your data to Microsoft's Power BI reporting environment with your authorization during setup. Once the connection is established, communication is encrypted to help protect your information.


Analyze Your Data Without Changing the Source

ITS builds reports using your existing business data without modifying the information stored in your source systems. This lets you analyze your data while keeping the original records intact.


Data Analytics Support Across the U.S.

Whether you're working with a local ITS team or need support across multiple locations, we help you turn your business data into reports and dashboards that support better decisions.

See Our Data Analytics Services

CLIENT TESTIMONIALS

What Do ITS Clients Say About Our Data Analytics Services?

See how ITS Data Analytics has supported organizations like Eastern Plumas Health Care (EPHC), where reporting and data insights play an important role in managing healthcare programs.

"When I started at the hospital, one of my first projects was to oversee the Department of Health Care Services' Quality Improvement Program. Without the support of the data analytics team at ITS, I would not have been as successful."

Screenshot (135) Joanna Garno Program Manager, Eastern Plumas Health Care (EPHC)
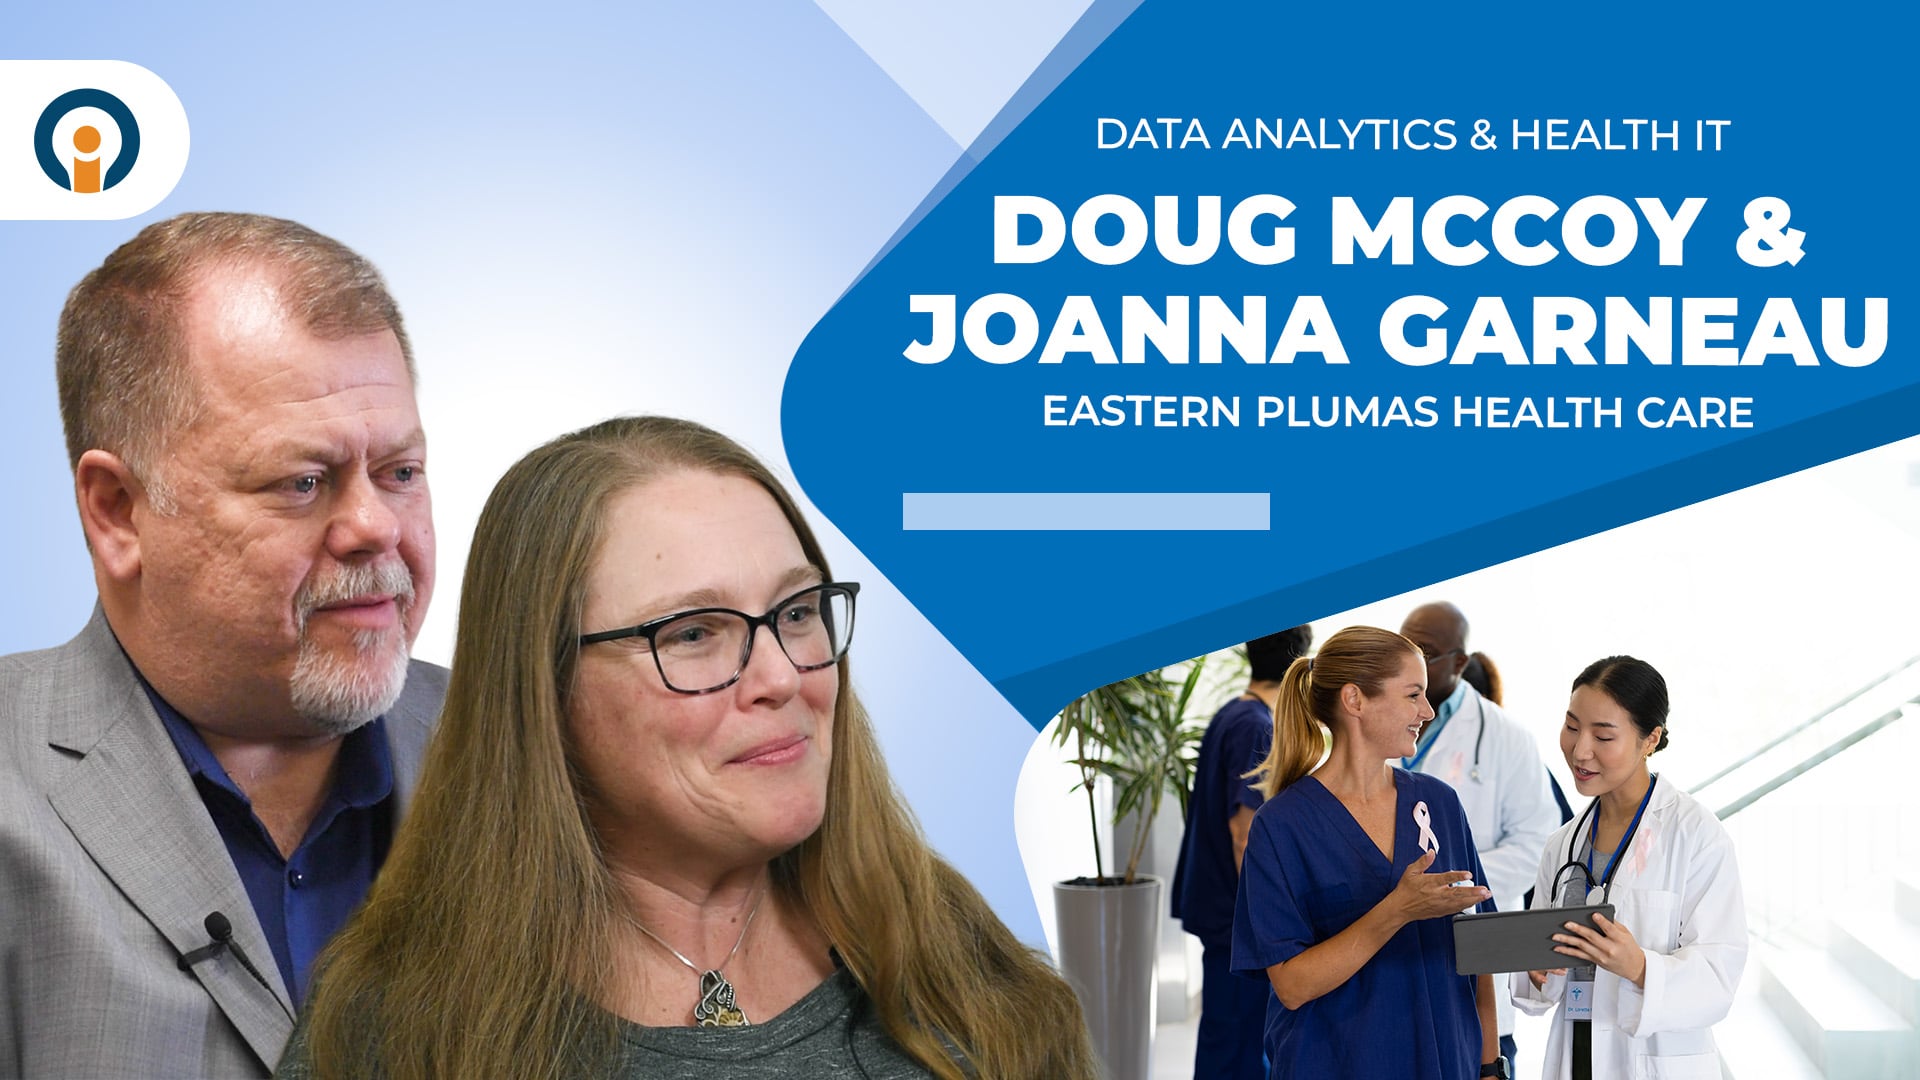
2025.05.07_ITS_EPHC Testimonial Videos (Doug&Joanna Health IT and Data Analytics)

Ready to Put Your Data to Work?

You don't have to figure out how to make sense of your business data on your own. ITS can help you identify what you want to measure, connect your existing data sources, and build Power BI reports that give you a clearer view of your business.

Ready to see what your data can tell you? Schedule a meeting with our team to discuss your reporting needs and explore how ITS Data Analytics can help.

FAQs

Frequently Asked Questions About Data Analytics

Q: What is data analytics?

A: Data analytics is the process of collecting, organizing, and examining data to identify patterns, track performance, and make better business decisions. You can use reports and dashboards to turn that information into insights your team can act on.

Q: Can small businesses benefit from data analytics?
 

A: Yes, small businesses can use data analytics to track sales, monitor expenses, and identify opportunities to improve operations. You don't need complex systems to get started, as long as you have relevant business data and clear goals.

Q: Do you need a data scientist to use data analytics?

A: No, you don't need an in-house data scientist to get started with data analytics. Your IT team or an outside provider can help you use tools like Microsoft Power BI to build reports and maintain your dashboards.

Q: How much does data analytics cost?

A: Data analytics costs depend on your software, data sources, and support needs. At ITS, pricing starts at $1,000 per data source per month with four support hours included, while additional work costs $225 per hour.

Q: How does ITS protect your data during data analytics?

A: ITS uses authorized connections and encrypted communication to help protect your business data. Our developers build Power BI reports using your existing information without changing the data in your source systems.